How we use AI in our process
 Operational control for fleet managers with Activate OS

Leading heavy equipment management and maintenance platform used by the largest construction companies.
Acquired by Sandhills Global thanks to UITOP software development work.

The software built years ago functioned as a passive data log rather than a help center for decision-making. Fleet managers couldn’t react fast to the possible downtimes and prevent them before the whole schedule crashes. This resulted in slow, reactive problem-solving and a total lack of oversight, forcing managers to make guesses that led to costly equipment downtime, errors, and missed deadlines.
This frustrated users and slowed down company growth. New integrations became more expensive, and the business lost money as customers left. Because the company couldn't adapt quickly to market changes, it was hard to stay competitive.
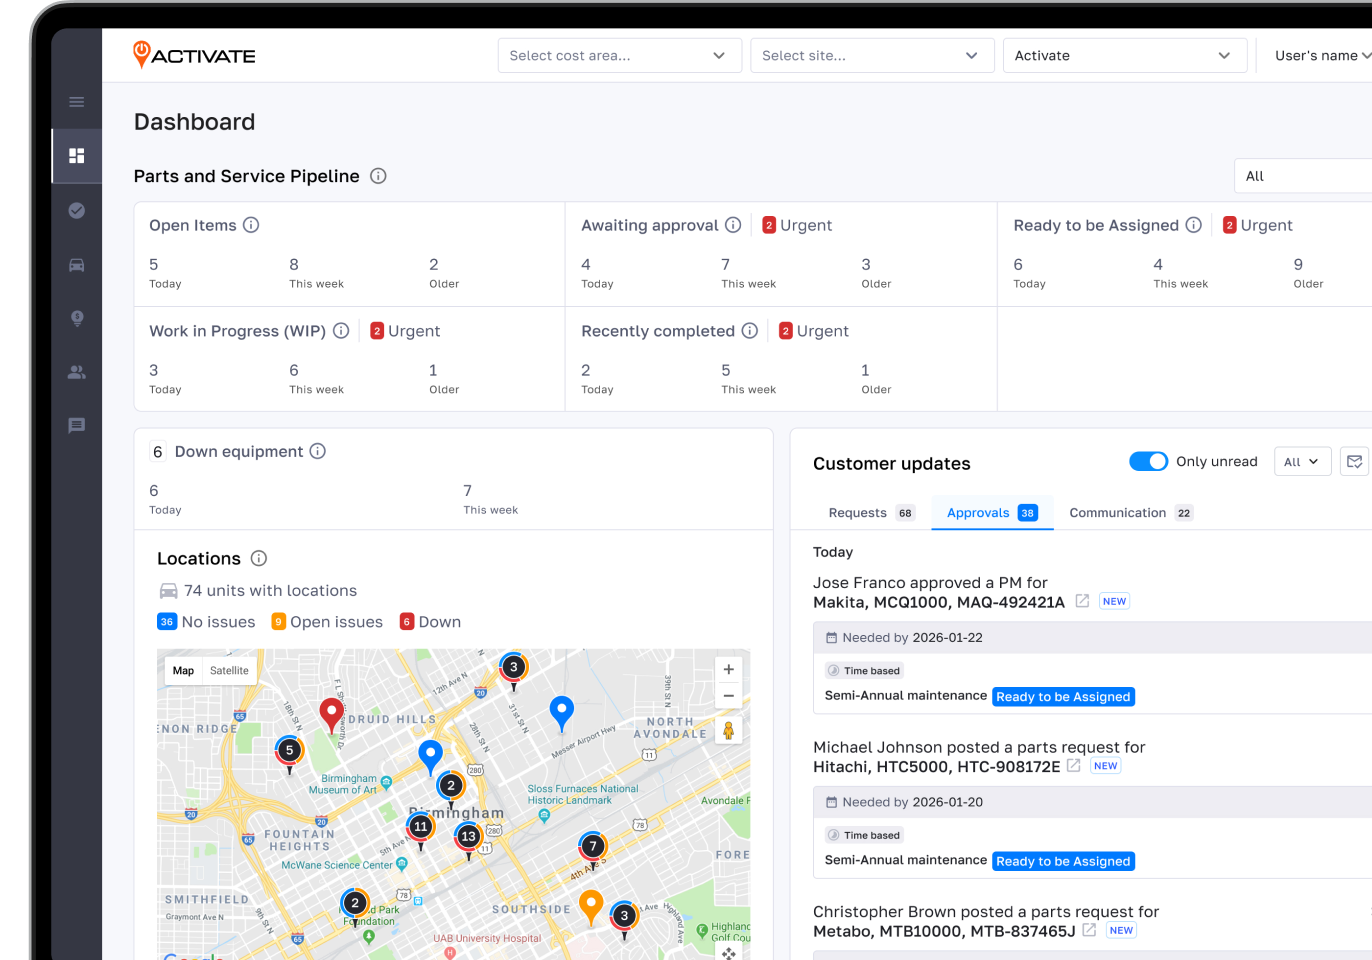
We engineered a real-time dashboard that connects people, equipment, and data in one system in real time. Now each user can easily track every part of the operation without switching between different screens and tools. In most products, great ideas are often created for the "future," but at Activate OS, we delivered that future every single month.
Our software development approach resulted in a 24.3% reduction in equipment downtime by streamlining field-to-manager data sharing. Users feel more in control than they have in 6 years, and they are now making decisions 2x faster.

Our Team
Our work began with a design pilot project focused on fixing the dashboard design. To build it, we brought in a frontend engineer and later added more engineers to handle new releases efficiently with a high quality code. To keep things organized and stable, we integrated project management and QA engineers.
Our process is built on a culture of fast feedback and shared responsibility for the product. Now, we operate as a complete R&D team where every specialist helps deliver new feature each month.

Project Brief
Activate OS is a centralized hub for managing construction fleets and field data. It bridges the gap between the office and the job site, making sure every piece of equipment is used efficiently. And our goal was to make it really work this way. This was a redesign of a live product with real users who were already used to the system. Our main rule: "Don't break what's already working."
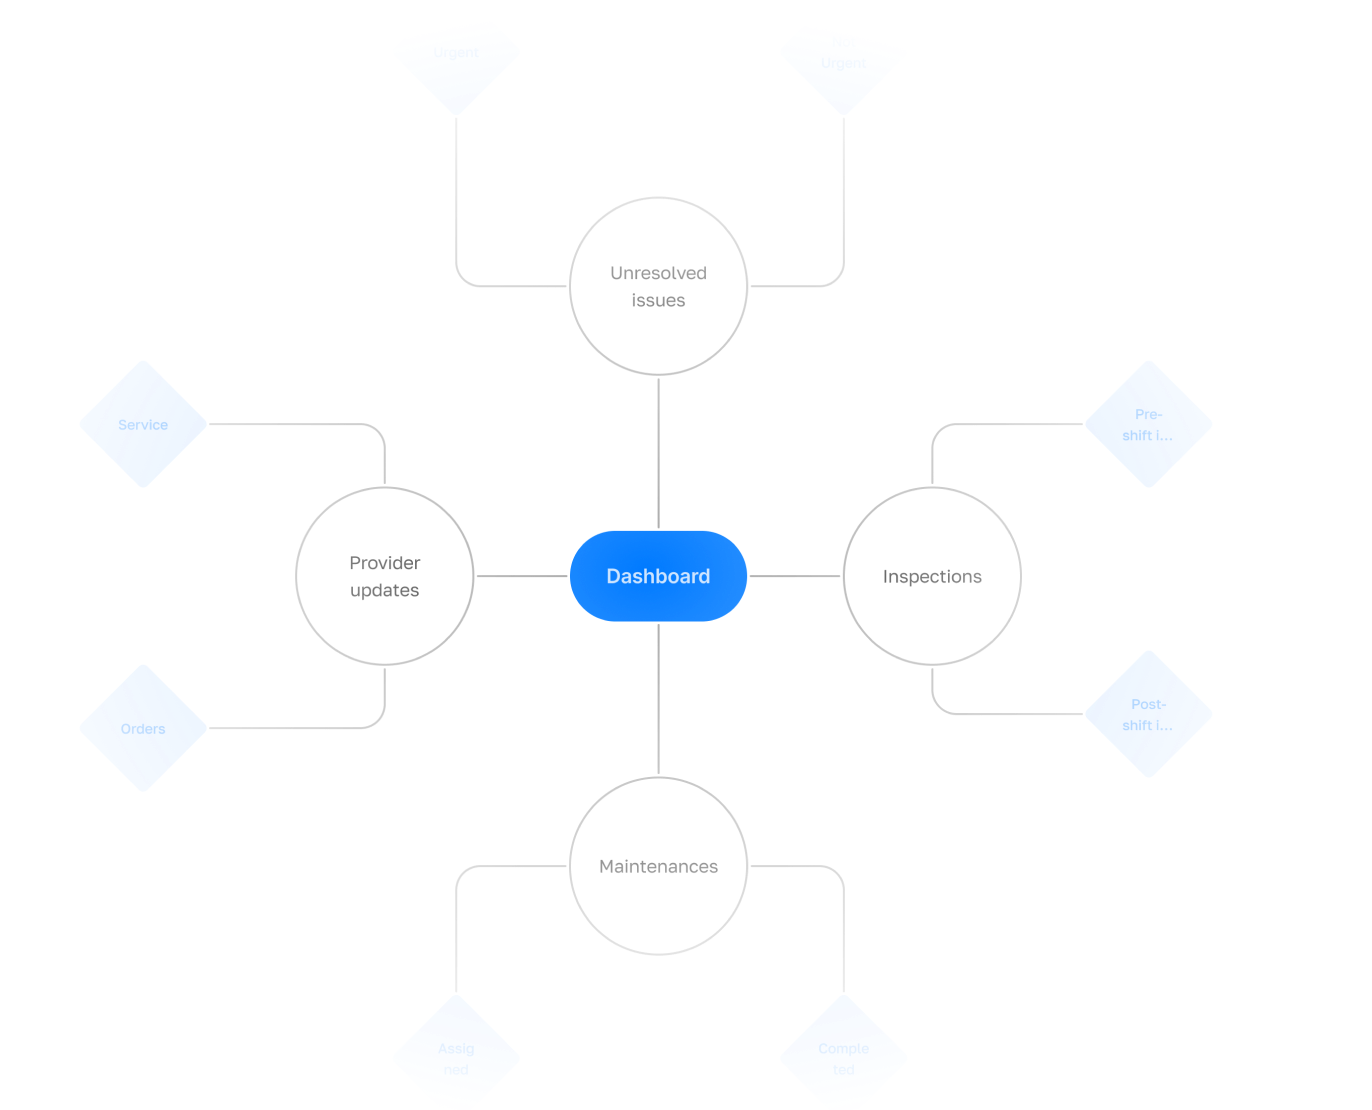
Users saw the data, but they couldn't easily use it to control their operations. We rebuilt the architecture to connect equipment, staff, and metrics in one simple system with a modular-based interface. We made the priority to deliver a better work experience with every next release. Users loved this pace because each update made their daily work easier.

High-Performance Map
We integrated Google Maps by developing a library of custom, reusable components, including InfoWindows, Markers, Clusters, and Geofence editing tools. This modular library allowed us to deploy advanced mapping features consistently across the entire platform.
To handle up to 20,000 active markers without UI lag, we optimized the data processing logic. Instead of letting heavy filtering and data transformations block the main thread, we split these operations into smaller chunks and offloaded them to Web Workers. This background processing ensured that calculations happened on a separate thread, keeping the interface smooth and responsive.

Modular Dashboard
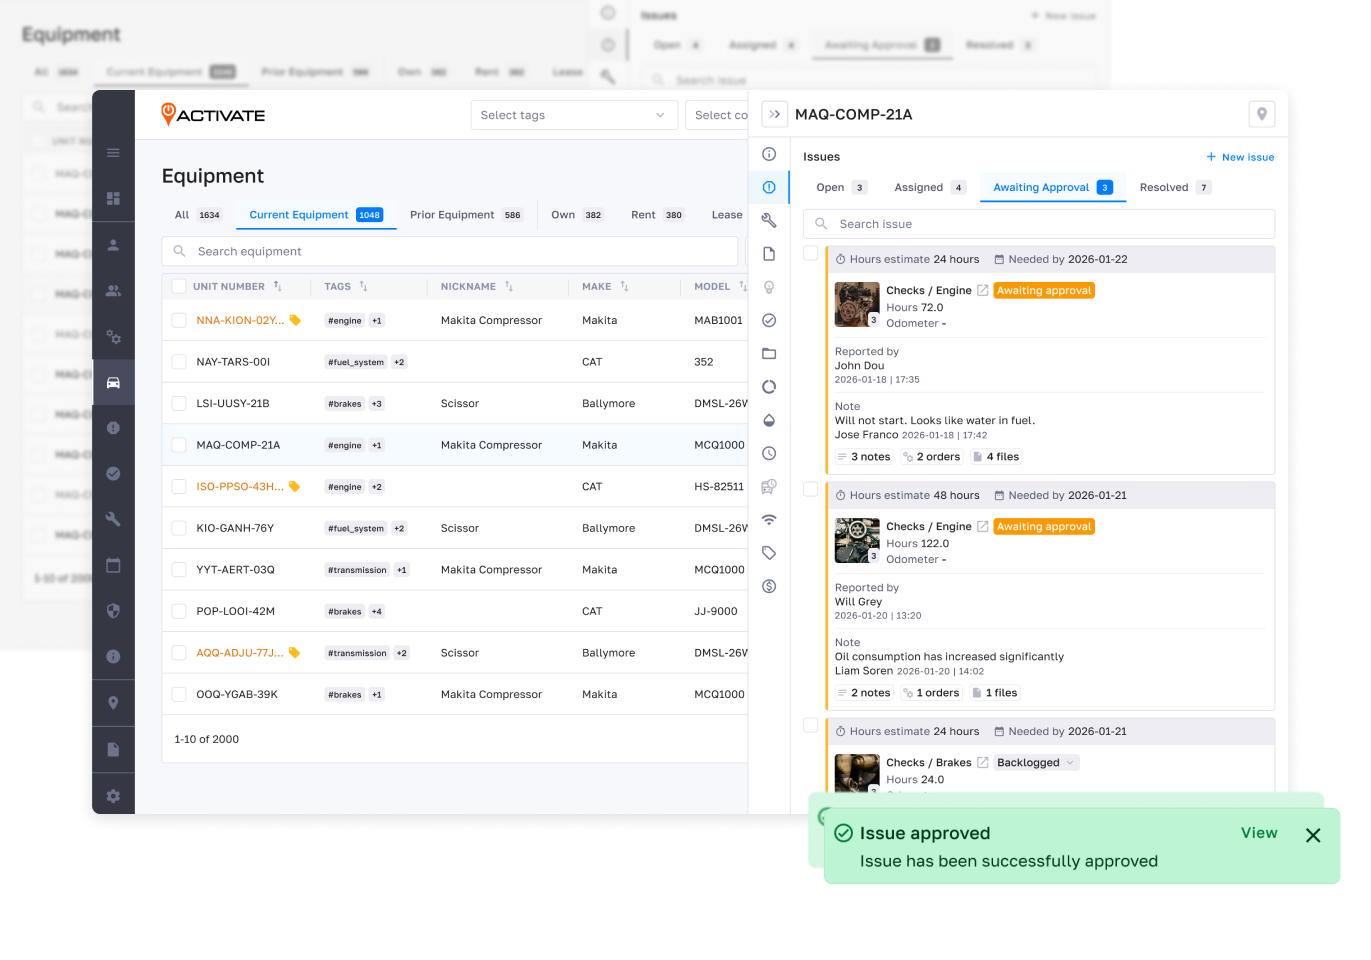
We replaced static tables with a dynamic dashboard built on normalized state management and memoized components for high responsiveness. By linking disparate entities through a unified data schema, we cross-referenced service work, issues, and inspection schedules. This allows users to drill down from fleet-level metrics to specific maintenance logs in one click without state loss.
Additionally, a long-polling strategy syncs data every 5 minutes to meet client requirements. This allows managers to track entire national fleets in one view, giving users a level of visual control over their assets they hadn't experienced in over 6 years.

Architecture Upgrade
We moved from a legacy monolith to a modular React architecture with a shared component library. This decoupled development and cut the release cycle from 3 months to 4 weeks. With new CI/CD pipelines and automated testing, we scaled the team 2.5X and maintained a steady pace of one new page per month.
To handle integrations like Caterpillar and Volvo, we built a middleware layer with idempotent APIs and schema validation. This ensures data integrity and system stability even under high loads. We also added distributed tracing and error logging to catch any issues before they hit production.


Similar cases


Technology
The interface matches well with the development frameworks. This ensures that the experience is easy for users.
Front-End


Back-End


Problem solving
A successful design process balances creativity and practicality, focusing on user needs and iterative feedback to improve usability and satisfaction.
Architecture
Design
Development
Quality Assurance