UX Audit for a Construction Intelligence Platform
Project details
- Industry
- Construction (site safety)
- Product type
- B2B AI web dashboard with cameras and IoT sensors
- Market
- B2B
- Services
- UX audit, competitor research, AI prototype concepts
- Timeline
- 5-day UX audit
- Team
- Budget
- Results
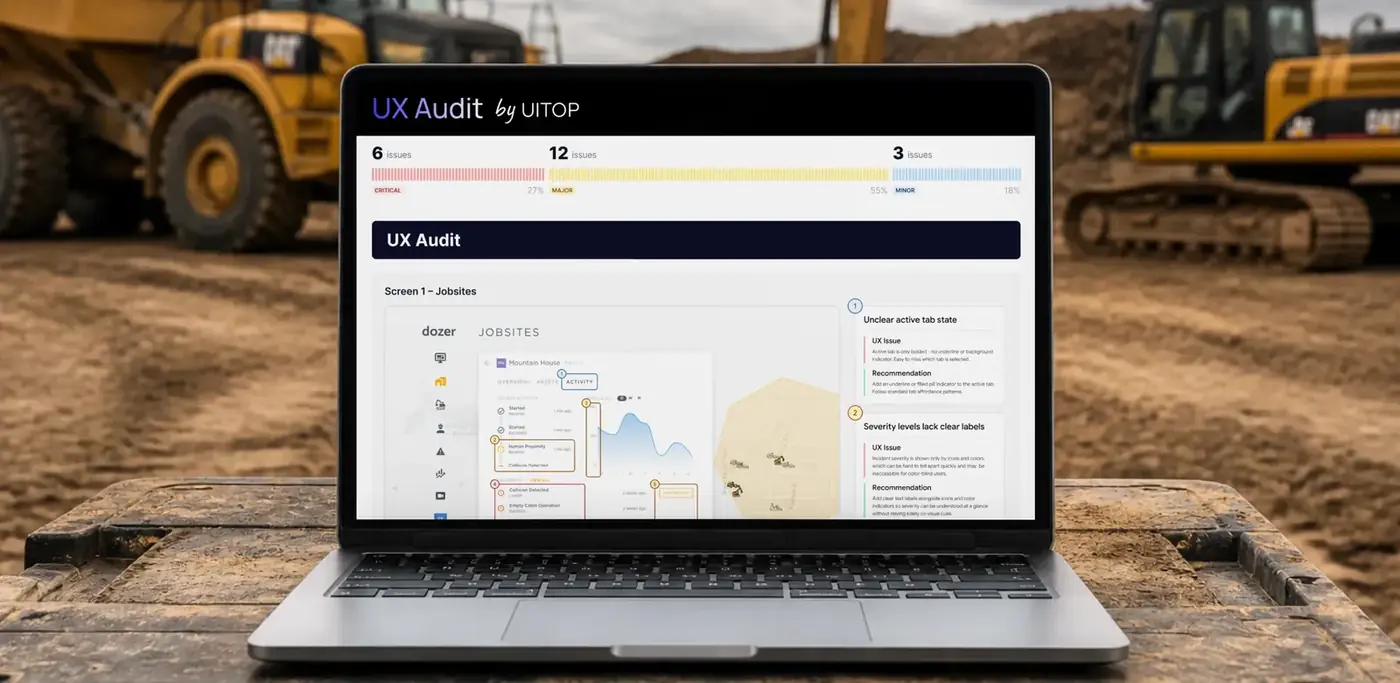
- 21 UX issues found, 6 of them critical
- 9 quick wins shippable in one sprint with no backend changes
- 4 dashboard screens reviewed
Challenge
UITOP’s Solution
Project Brief
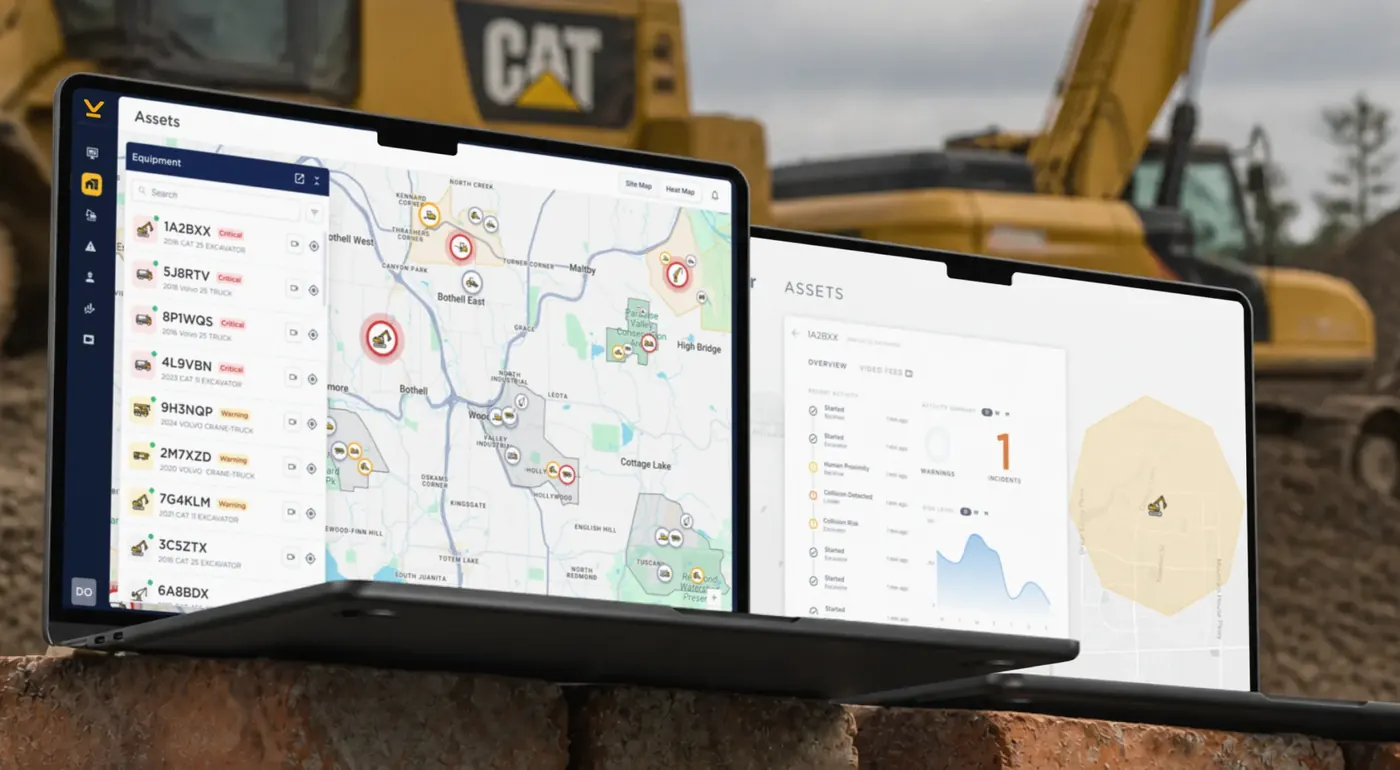
VigilYard collects live video, sensor data, and safety alerts from dozens of heavy machines at the same time. This creates too much information for site managers, meaning the dashboard just displays numbers instead of helping them take quick action.
Although VigilYard already had a working product with real customers, users missed critical safety alerts and ignored key features because the screen lacked visual urgency. UITOP stepped in to find exactly what blocked the user experience and showed the team where to focus their fixes first.
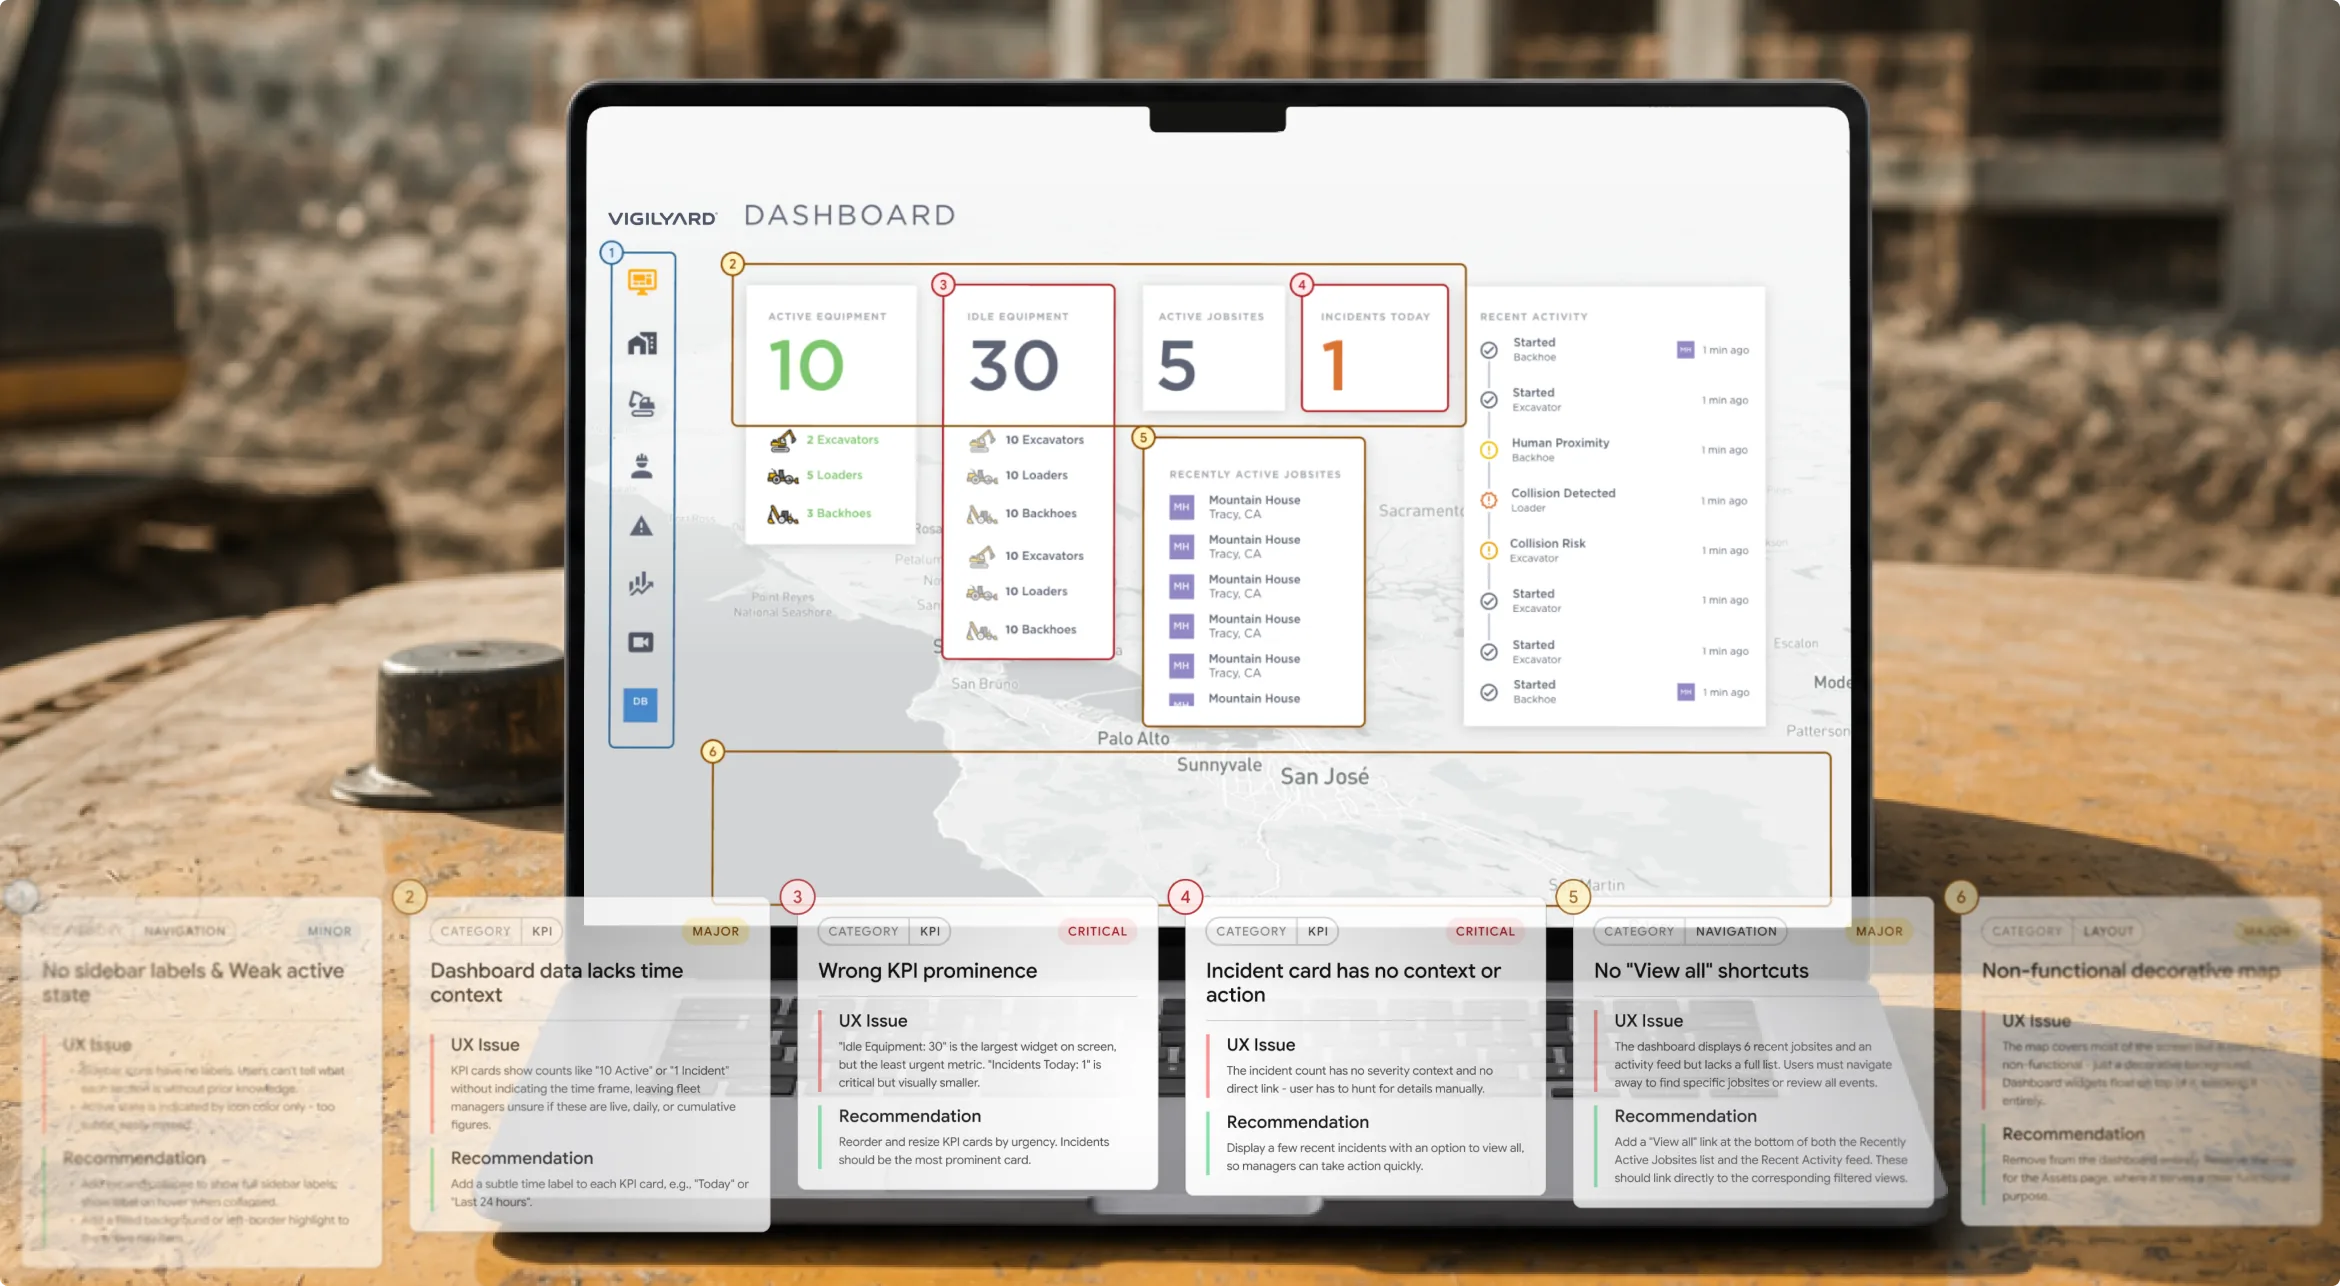
Dashboard
Problem
The main dashboard overloaded users with too much information at once. Fleet status, live alerts, recent activity, and equipment health indicators all competed for attention without a clear visual hierarchy. Because of this chaos, users trained themselves to look for specific numbers and missed other critical updates.
Solution
We found 6 major UX issues on the dashboard alone, making it the most problem-dense screen in our audit. The main problems included inconsistent safety alert signaling, KPIs that lacked time context, and a layout that buried urgent data. Our audit provided a prioritized list of fixes, ranging from quick label changes to structural updates that separate daily operational views from analytical reports.
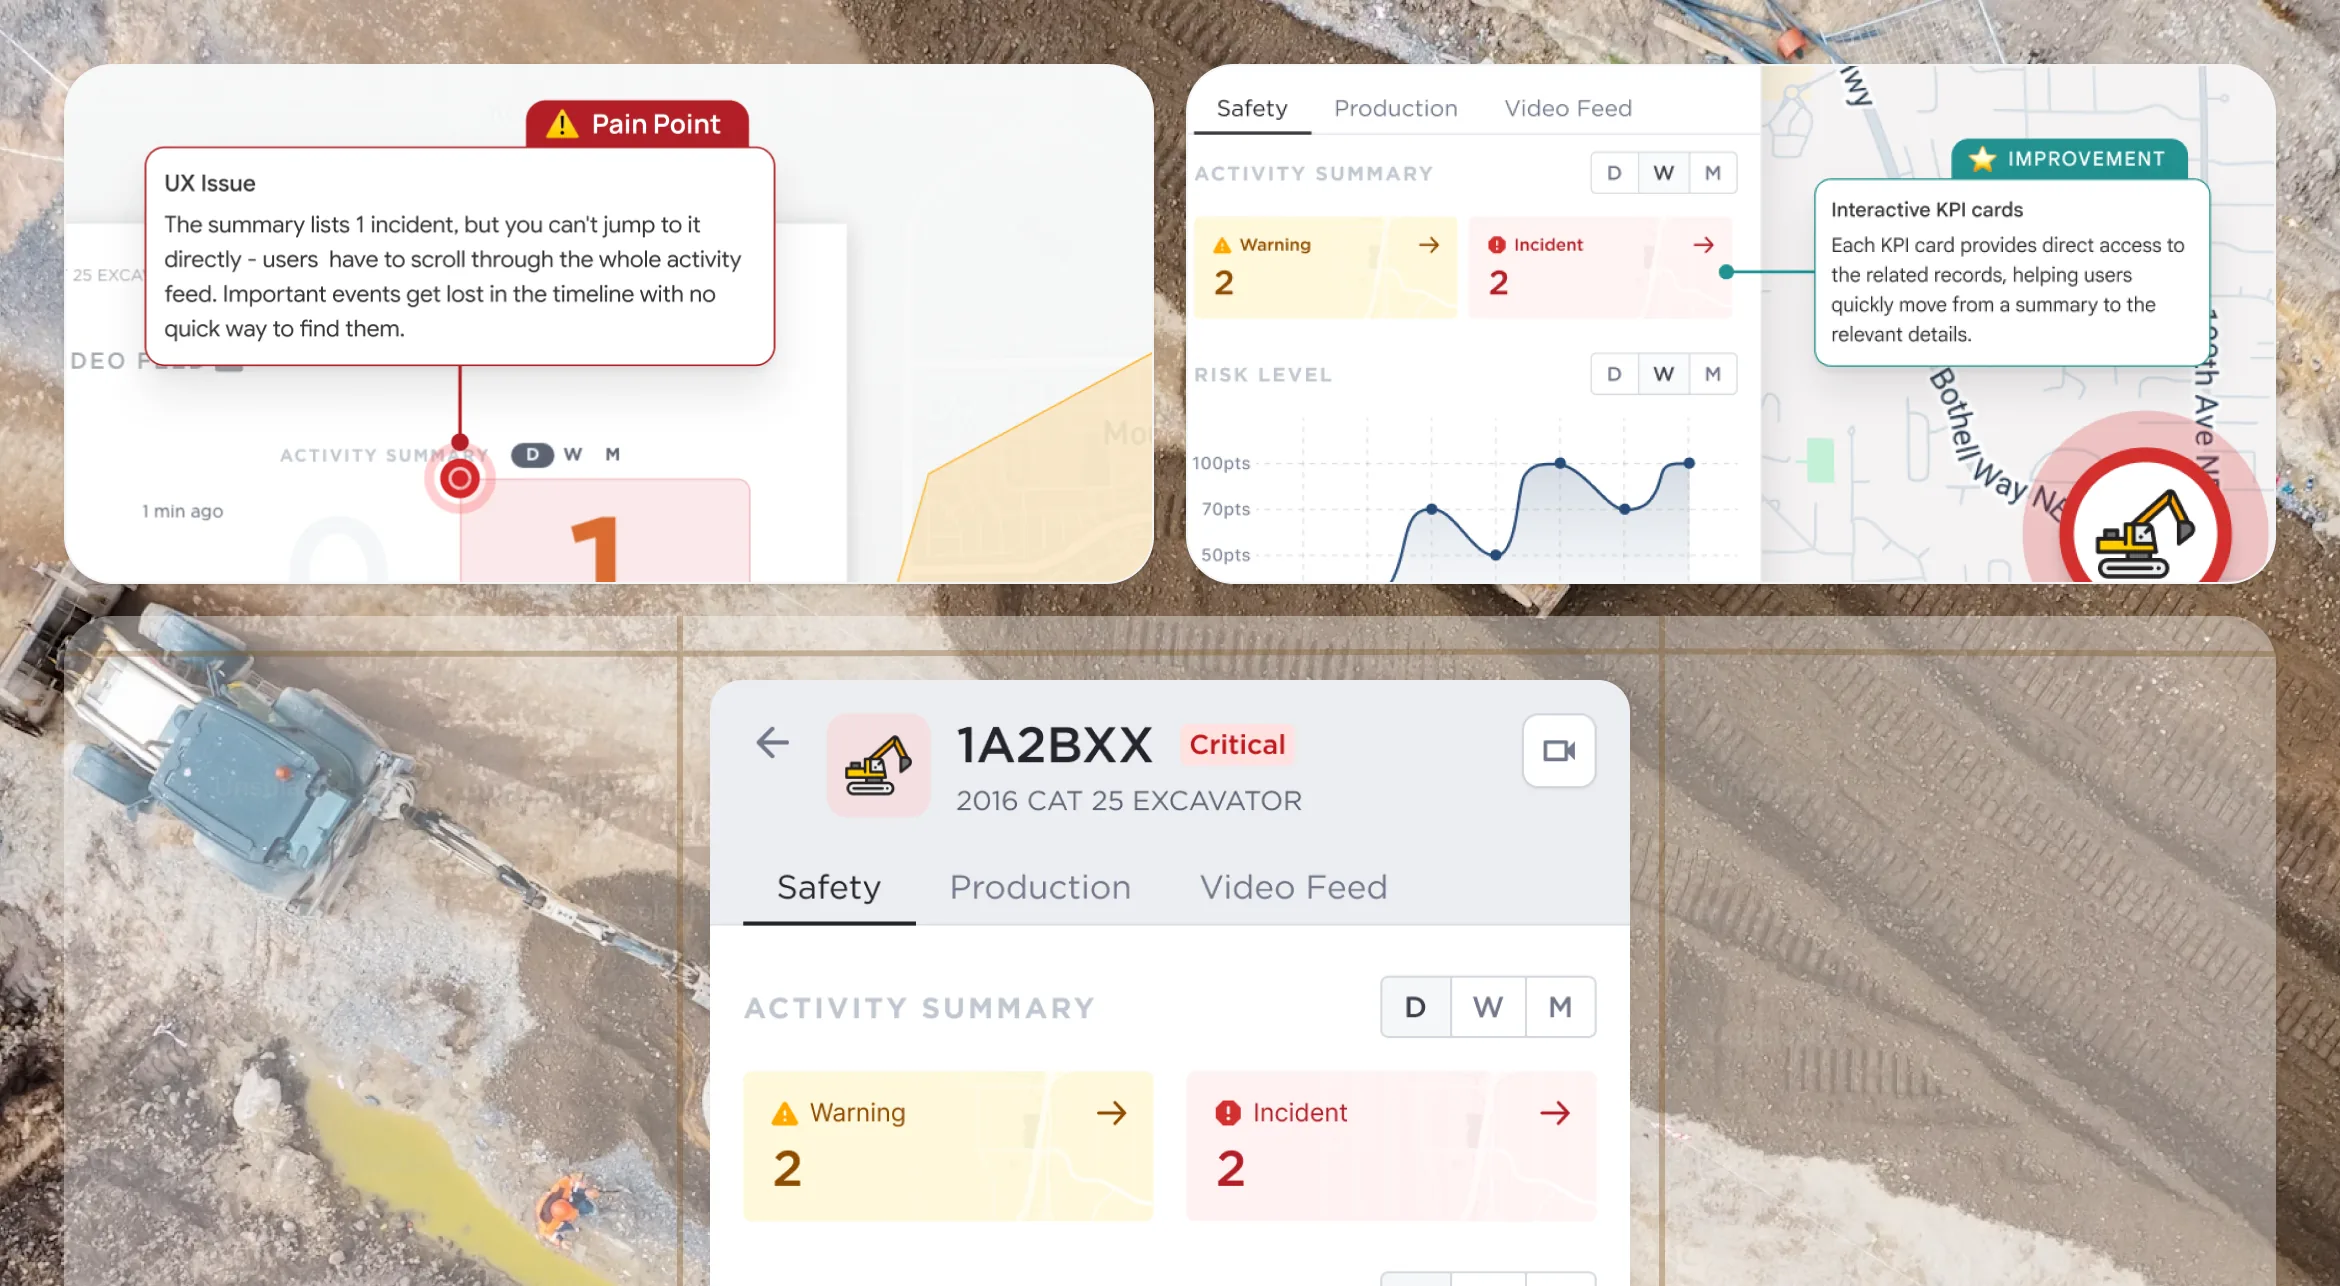
Safety Alert Flow
Problem
Proximity alerts are VigilYard's core safety feature, but multiple UX friction points slow down the flow from "alert fires" to "manager takes action. Because live alerts and historical logs used the exact same visual design, there was no way to tell what needed attention right now versus what had already been handled.
Solution
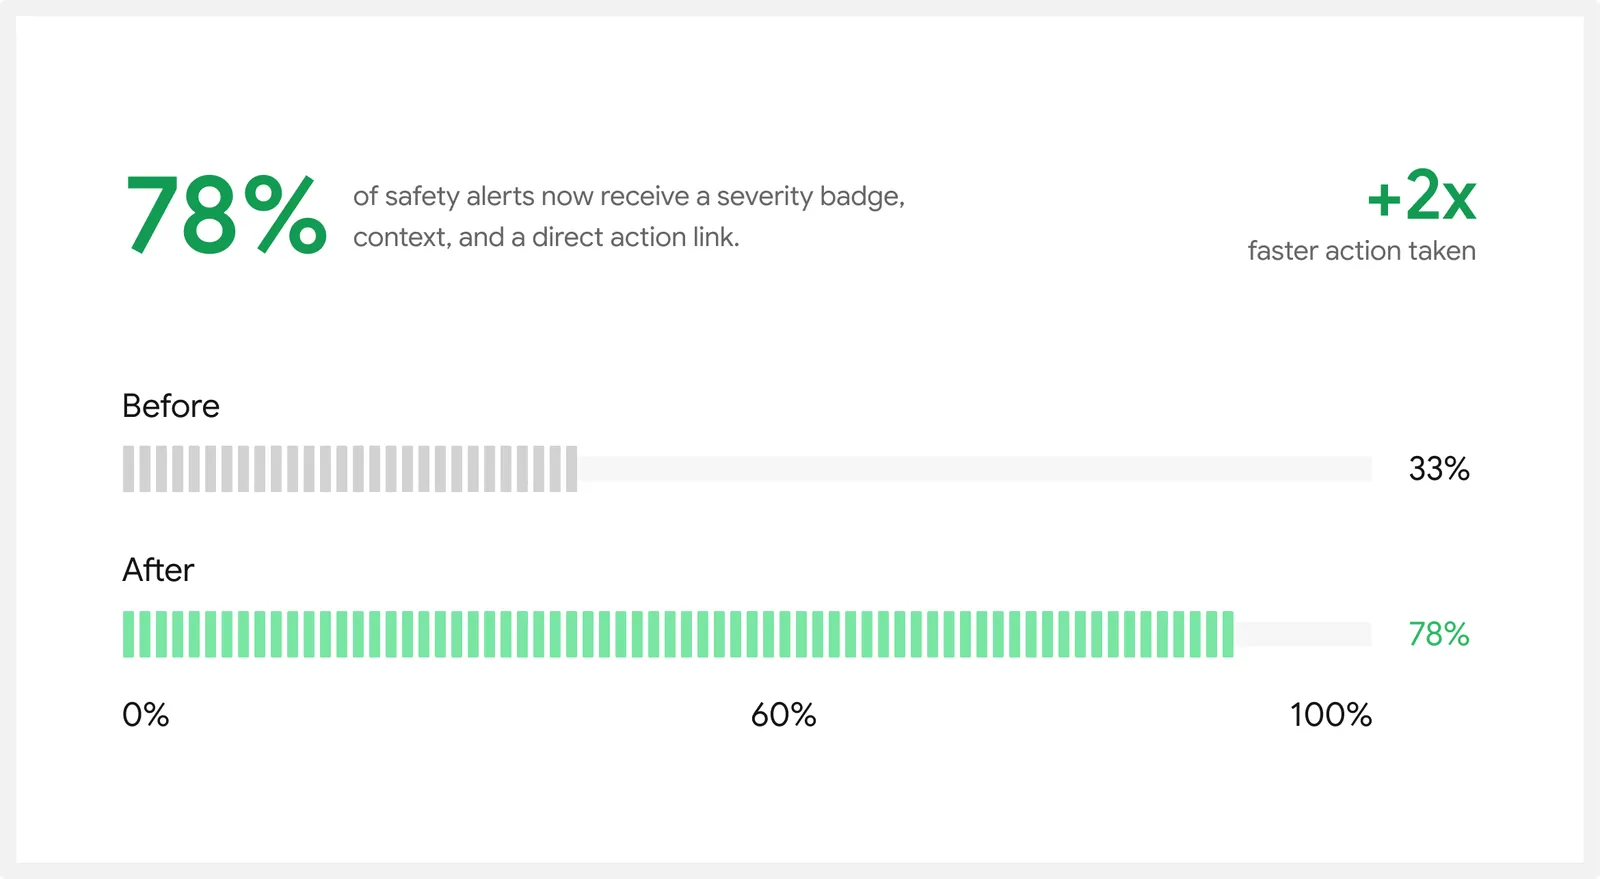
We mapped the entire alert lifecycle to find exactly where the interface lost its sense of urgency. The audit revealed that the notification panel styled unread and acknowledged alerts identically, while the Equipment View lacked inline alert badges. To fix this, we recommended a 3-tier status system (Active / Acknowledged / Resolved) and a special sorting screen for the 6 critical-severity safety events.
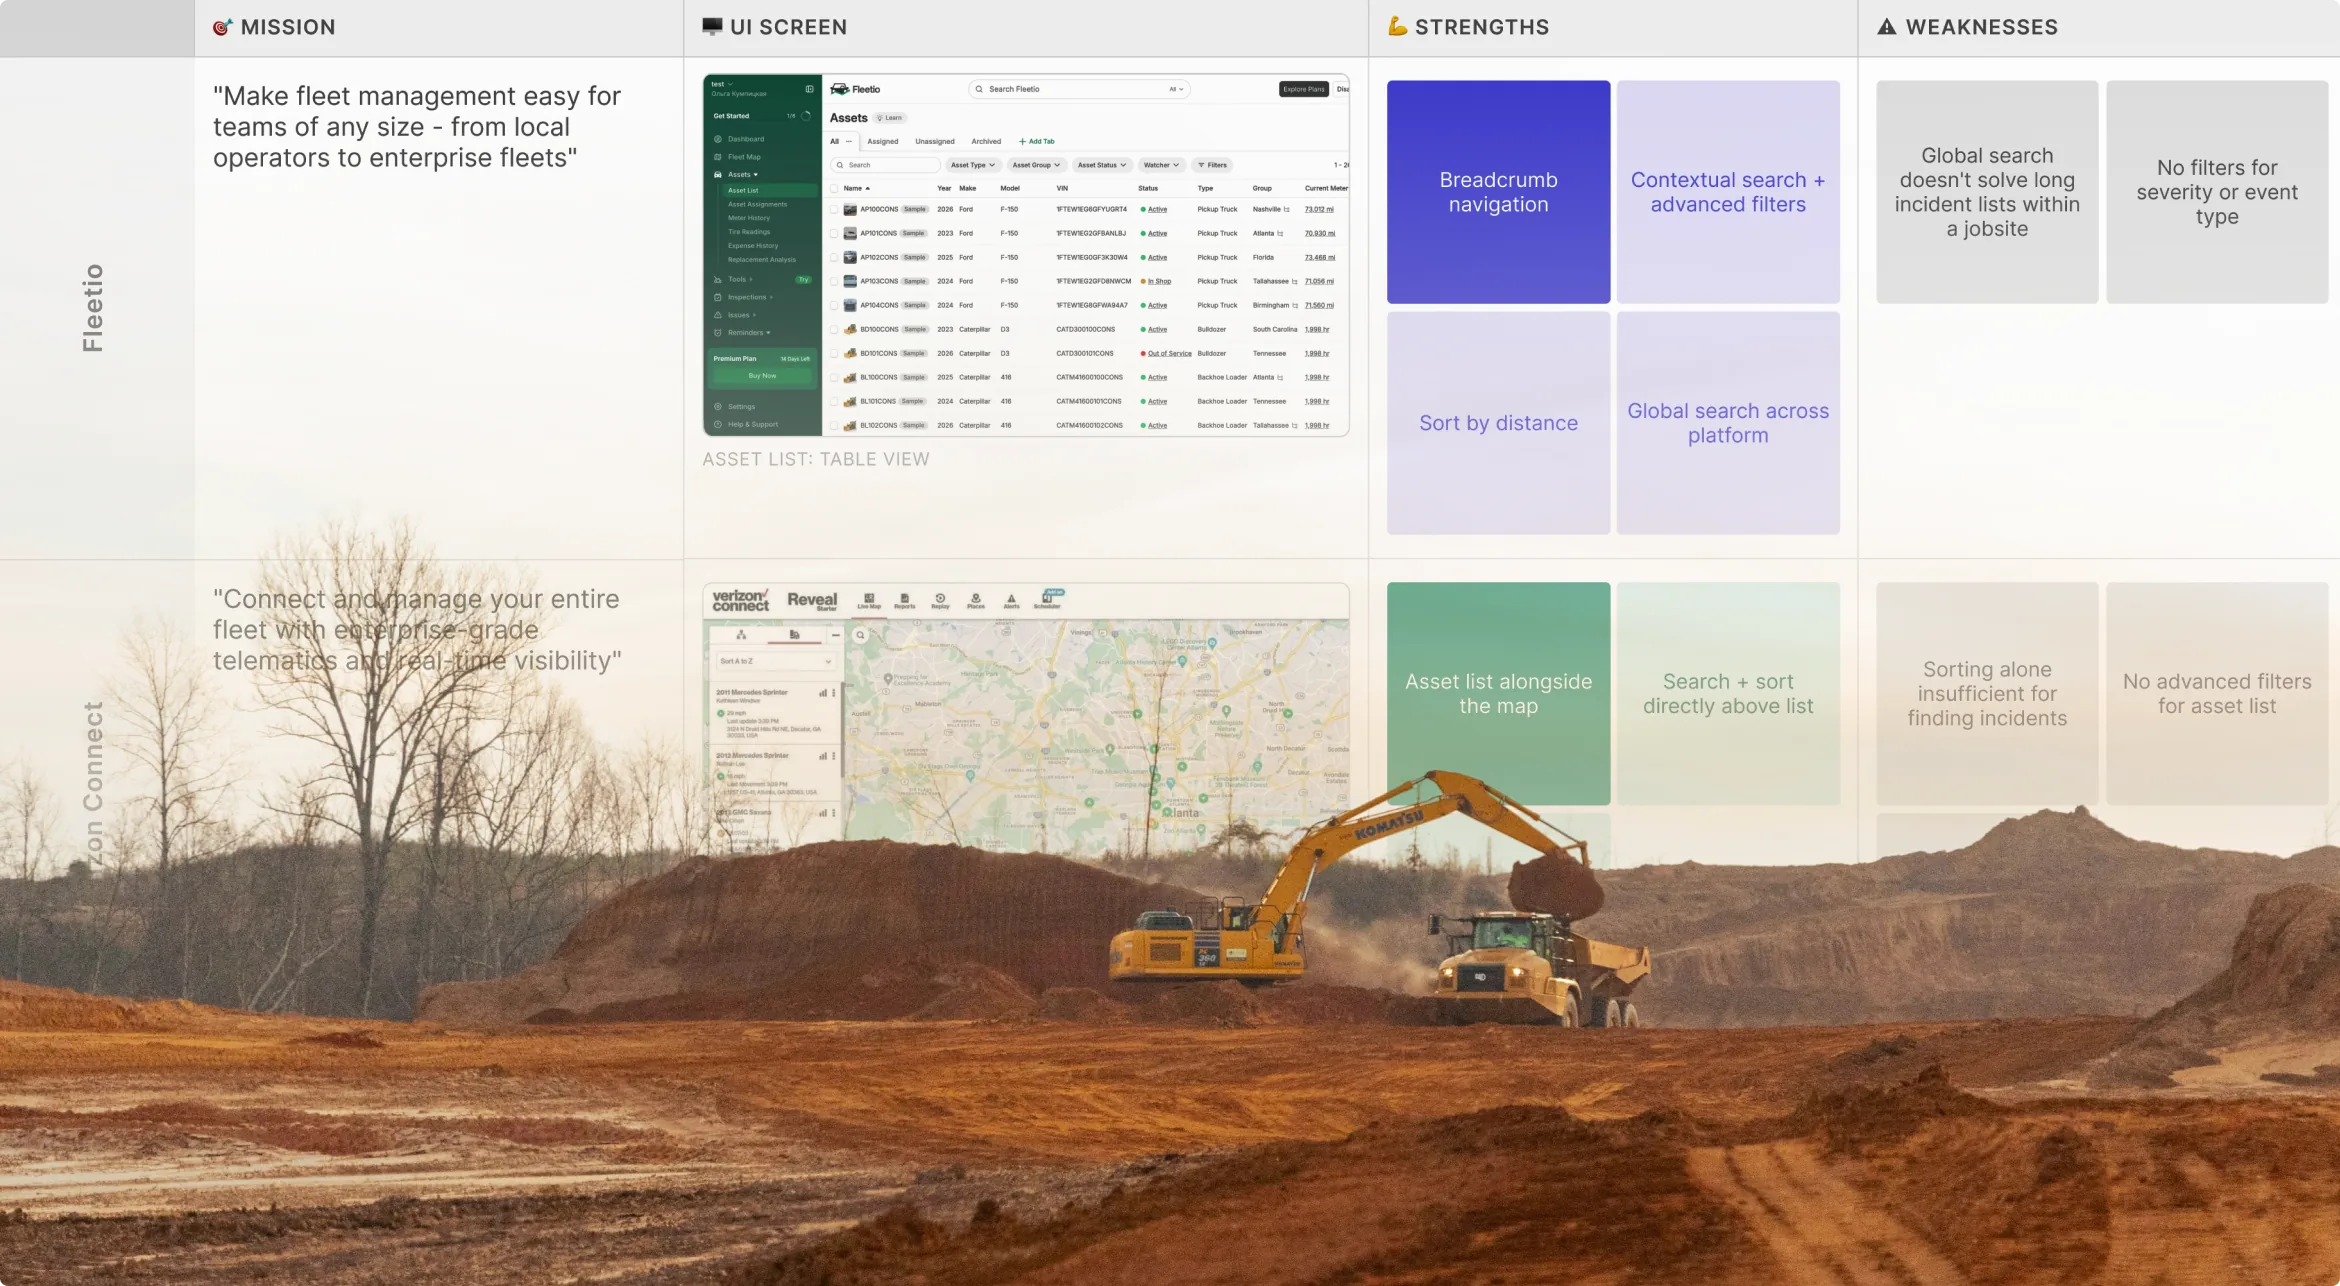
Competitor Research
Problem
VigilYard operates in the growing construction site intelligence market, where direct competitors like Samsara, Fleetio, and Trackunit have already heavily invested in UX design. Because of this, several standard interface patterns that field operations users expect were completely missing from VigilYard's platform.
Solution
We analyzed six direct competitors focusing on alert management, navigation, KPI displays, and map usage. This research highlighted industry standards to adopt, such as severity-first alert hierarchies, as well as bad design patterns to avoid. Since many competitors have overloaded dashboards, we showed how VigilYard can differentiate itself by building a simpler, faster operational view.
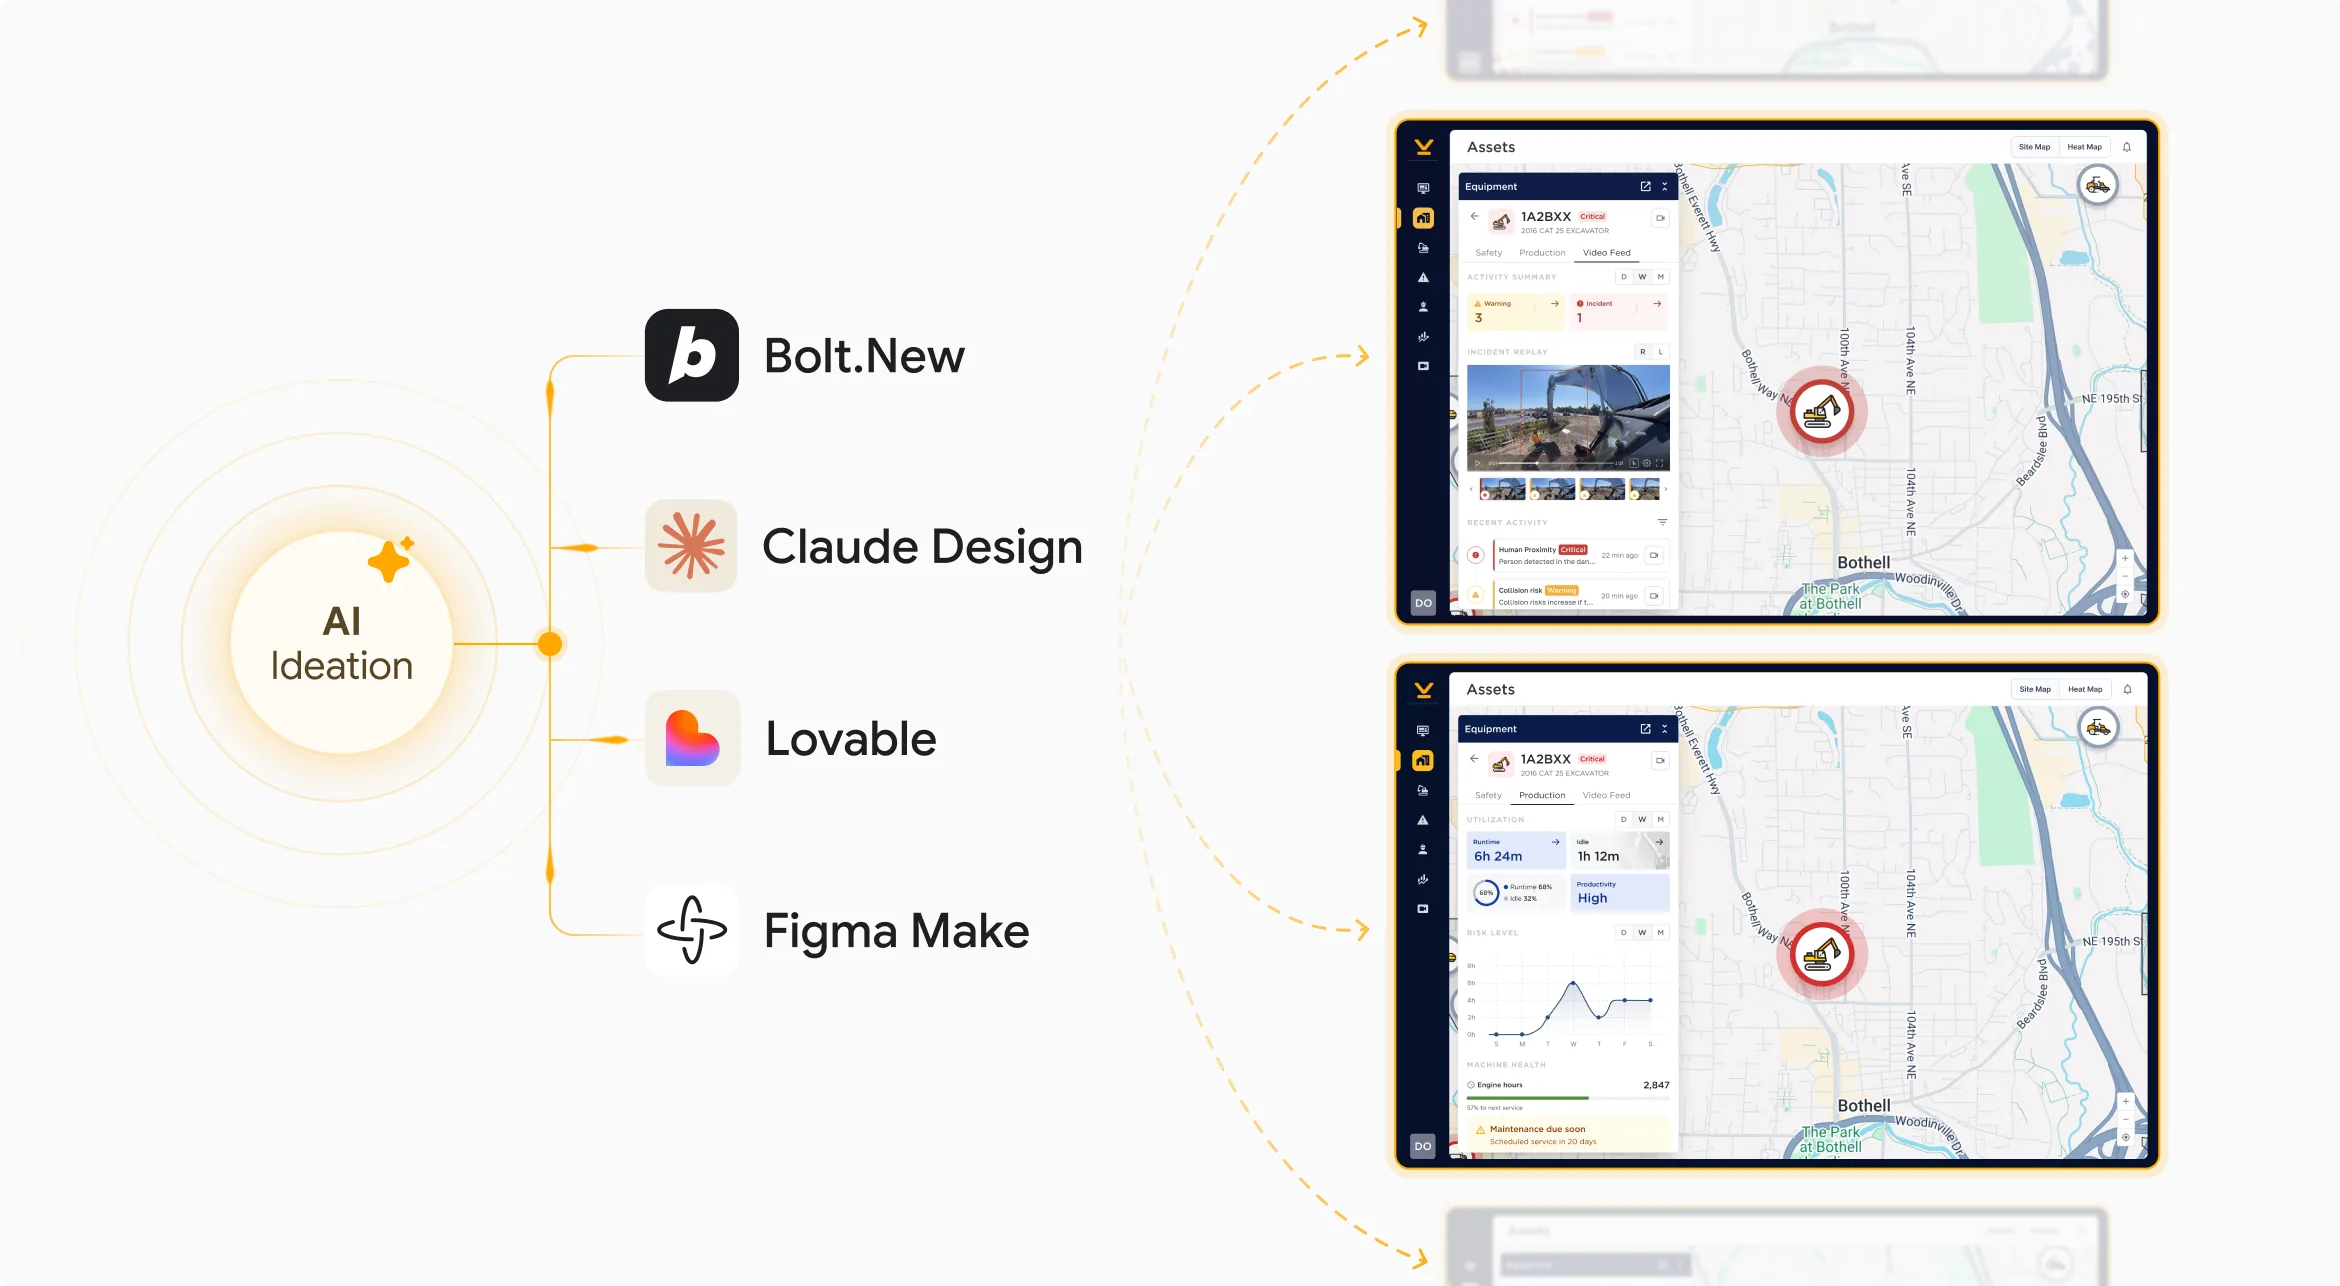
AI Redesign Concepts
Goal
To make our 21 UX recommendations easier to act on, we prepared visual prototype concepts for the Dashboard and Safety Alert Flows. We generated these design directions using AI prototyping tools including Bolt.new, Lovable, and Figma Make as an extra project bonus. This allows the product team to clearly visualize every layout improvement and interactive optimization instead of just reading about them in the written report.
Prioritization
Goal
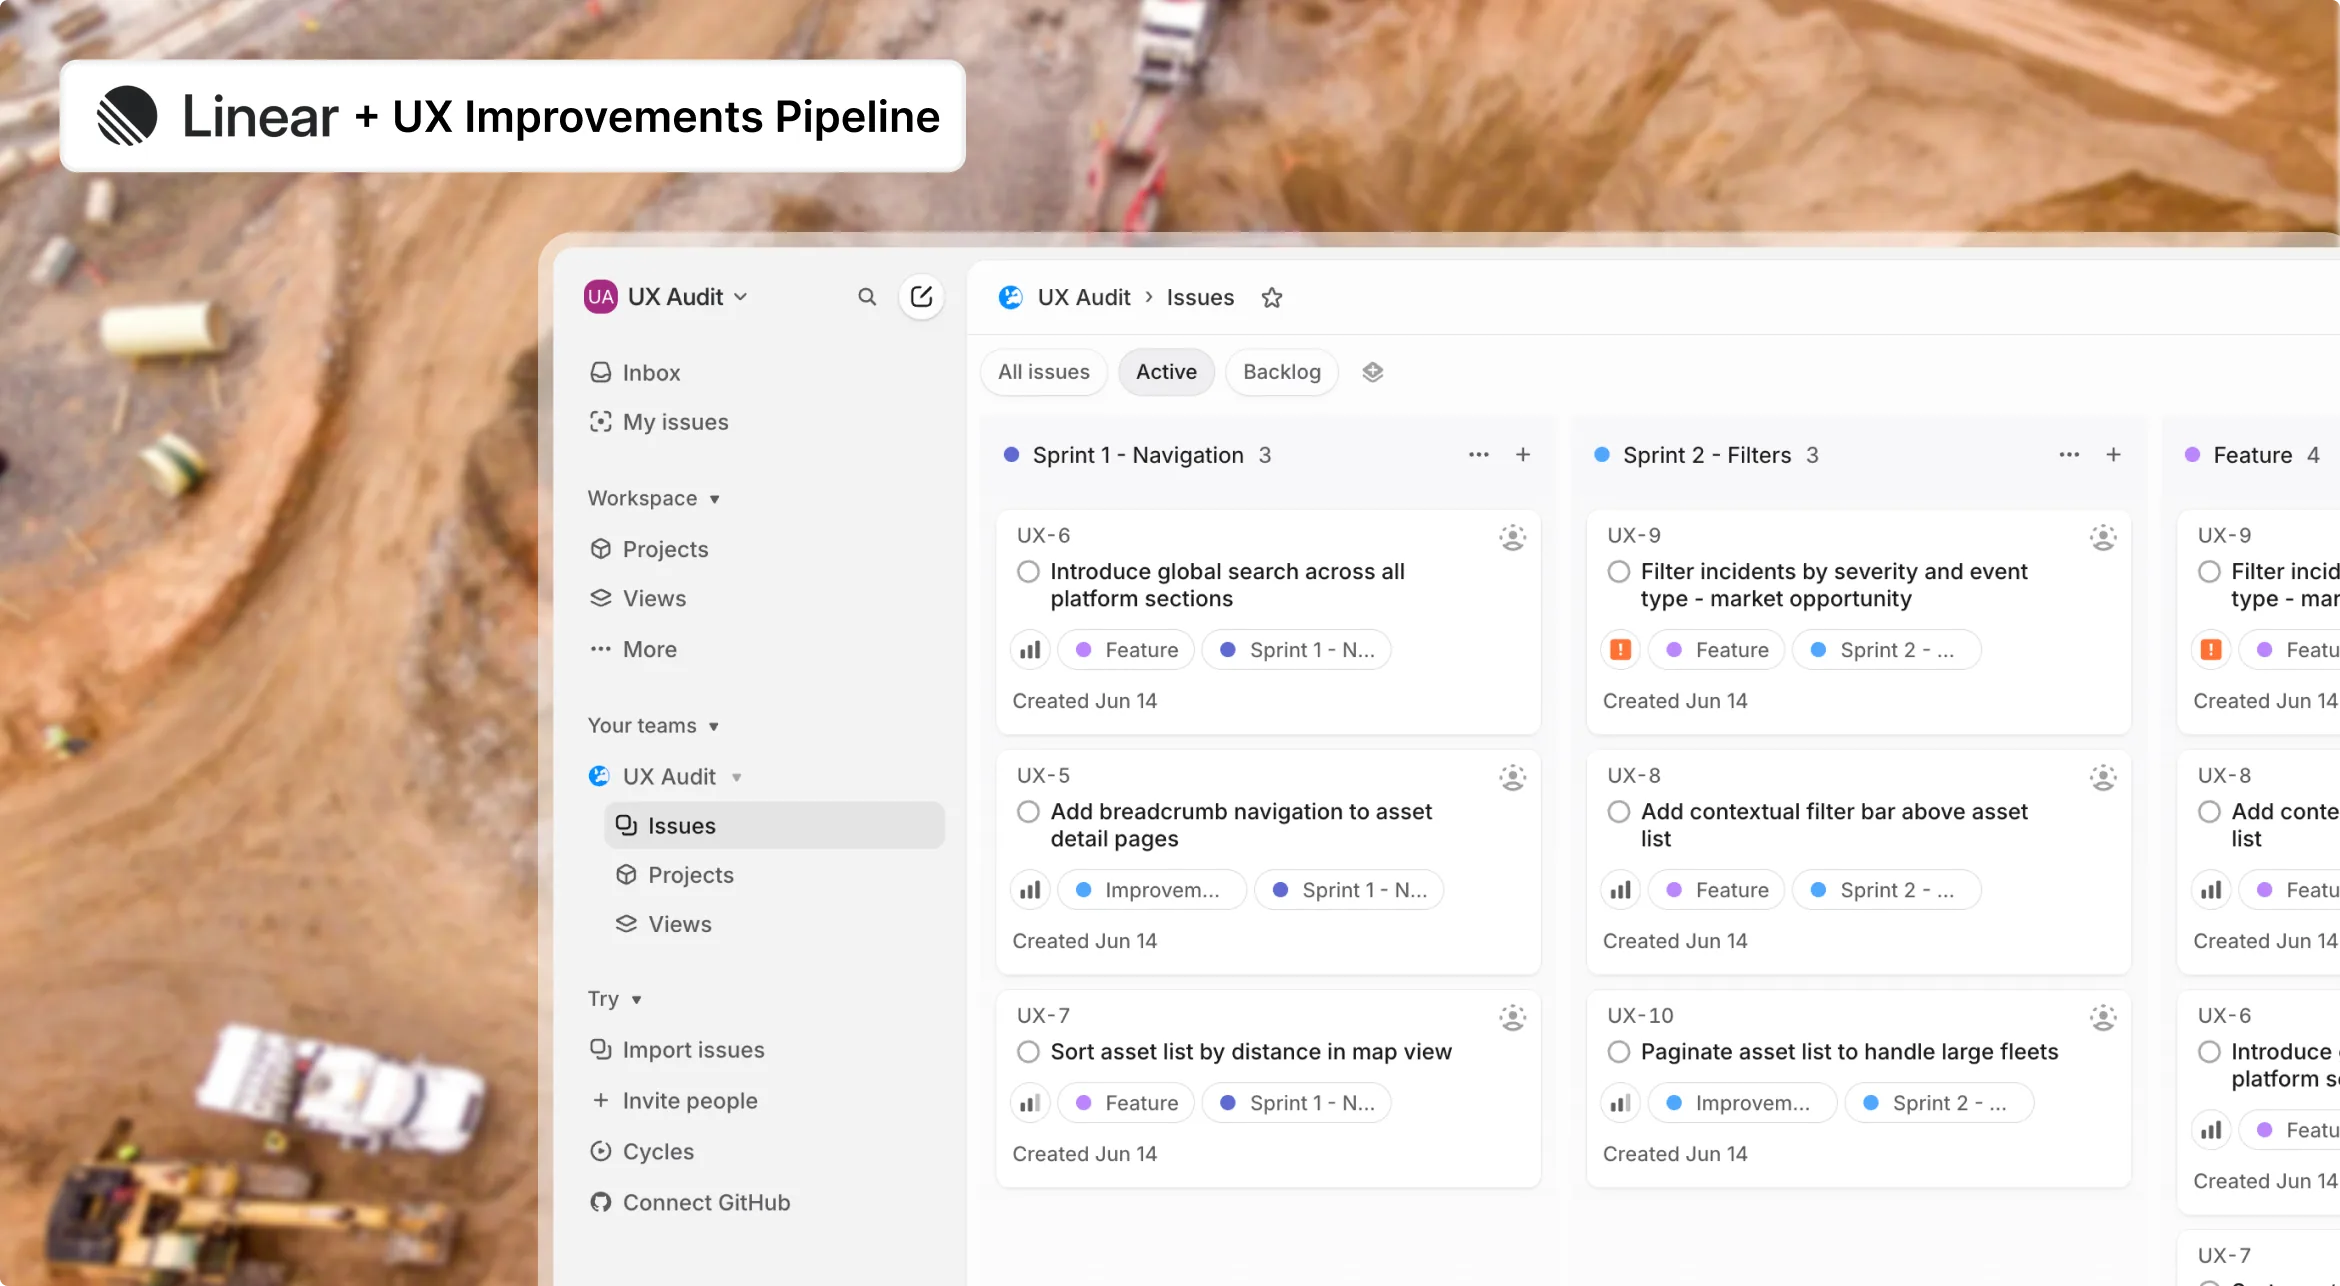
Not every UX issue requires the same priority, so we organized all 21 findings into three tiers: critical, major, and minor. We separated 9 immediate quick wins from larger structural changes and mapped them directly into Linear. This output fits perfectly into sprint planning: the team can track and ship the quick wins in a single sprint with zero backend work, while the remaining 12 issues form a clear roadmap for the next quarter.
Impact
Problem
Before UITOP’s UX audit, the product team lacked a clear picture of which specific interface issues caused the most friction across the 4 evaluated dashboard screens. They did not know where to focus their development resources first to improve the user experience effectively.
Solution
The 9 quick wins fit into a single development sprint and need no backend changes. They target the safety alert flow, the dashboard and navigation for new users, where the audit found the most friction.

Feel that something is wrong with your interface or UX?
Similar cases


Technology
We used our UX expertise, Figma for audit documentation and annotations, and AI prototyping tools to generate concept directions as a bonus deliverable.

Our Expertise

Figma

AI prototyping
Problem solving
Get access to live system and kick off
We start by logging into the actual product. This approach offers the only way to catch real user friction like broken states, slow flows, and edge cases. During kickoff, we align on scope, target users, and the specific screens that matter most.
Review current flows and pain points
We walk through key user scenarios, such as opening the dashboard, responding to an alert, and checking equipment status on the Assets page. Along the way, we mark every point where the interface confuses the user or slows down their workflow.
Best practices and competitor benchmarks
We evaluate the product against industry standards and competitors to find where the design lags behind expected user patterns. This benchmarking shows where the platform can improve to gain a real competitive advantage.
AI Redesign Concepts [Bonus]
For complex issues that are hard to explain in writing, we generate illustrative concept directions using AI prototyping tools. This allows the development team to see exactly what the layout improvements look like instead of just reading about them.
Prioritize improvements
We group every finding by impact, urgency, and engineering effort to separate immediate quick wins from major structural changes. This structured output maps directly to product management tools so the team knows exactly what to fix in the next sprint and what to plan for later.